Homelab Kickoff: Building a 3-Node k3s Cluster from Scratch
Building a 3-node k3s homelab from scratch with GitOps, monitoring, and secure Cloudflare Zero Trust access plus real troubleshooting lessons learned.

Project Details
Homelab Kickoff: Building a 3-Node k3s Cluster from Scratch
Over the last ~5 months, my main goal has been to become a Cloud Engineer (or DevOps Engineer). I started from ground zero with no prior experience with Linux, containers, or Kubernetes. That said, I have been steadily leveling up through hands-on work (including earning my Google Professional Cloud Architect cert).
This post is the kickoff of my homelab: a real 3-node k3s cluster with GitOps, monitoring, and secure external access.
Definition of Done (DoD) Objective
My “done” state for this phase:
- Bring up a working, repeatable Kubernetes cluster on my own hardware
- Add core platform services: GitOps + observability
- Expose dashboards securely for real ops workflows (without punching unsafe holes in the network)
Hardware + Topology
I’m running three used Lenovo ThinkCentre M920q nodes which offer great performance for the price, and a perfect “get things going” setup I can expand later.
Meet the nodes:
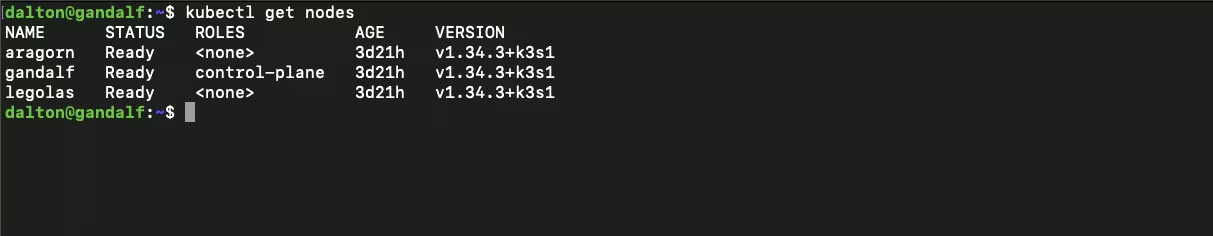
- Gandalf (k3s server)
- Aragorn (worker)
- Legolas (worker)
All three run Ubuntu Server 24.04.3 LTS with a minimal, clean bootstrap (updates, SSH, hostnames). Network security is handled by my UniFi home networking setup.
Why k3s?
I wanted something more hands-on than Rancher Desktop Kubernetes, but not full “jump off the deep-end” just yet (kubeadm); something that I could not only learn Kubernetes with, but also not end up wanting to tear down and replace in 3 months. k3s has been the perfect middle ground: lightweight, practical on small hardware, and still teaches the real primitives (namespaces, deployments, services, ingress, etc.).
The Platform Layer: GitOps + Observability + Secure Access
Once the cluster was up, the real learning started:
- GitOps with Argo CD
- Monitoring with Prometheus (kube-prometheus-stack style components)
- Ingress via Traefik + LAN load-balancer IP
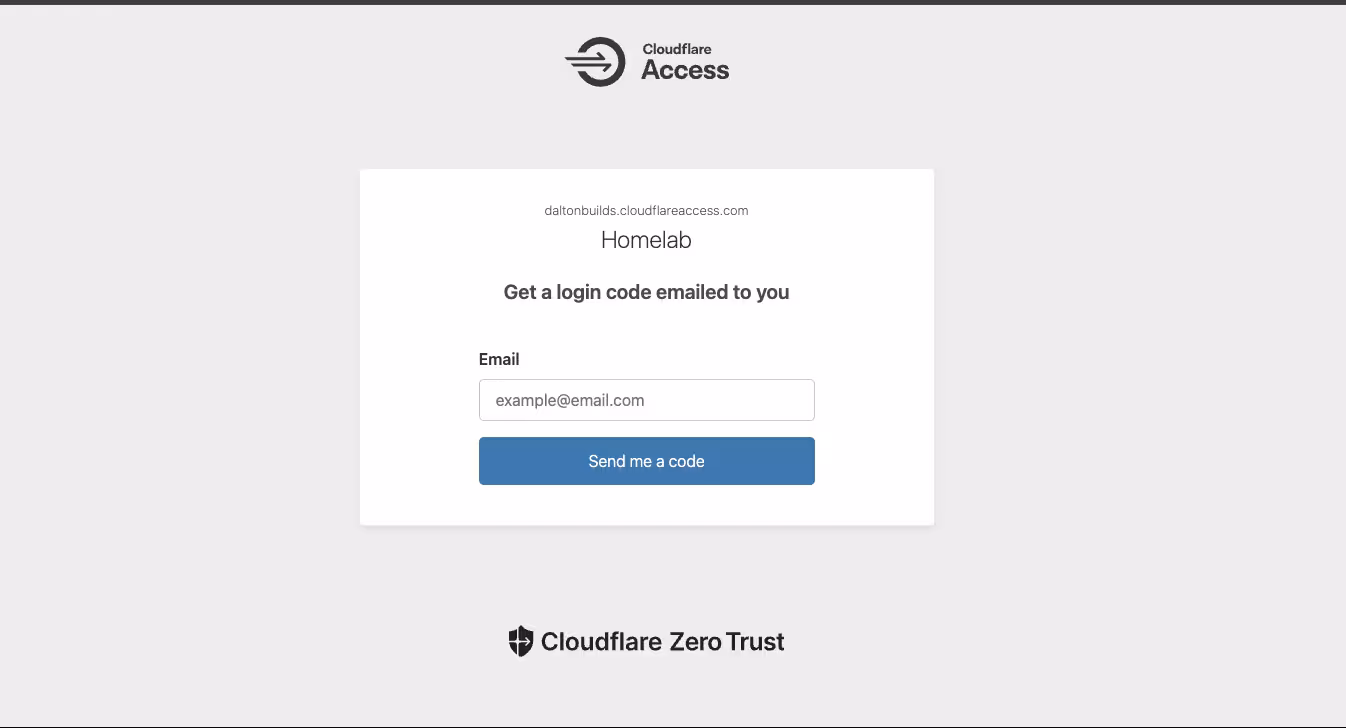
- External access through a Cloudflare Tunnel, with Cloudflare Zero Trust Access protecting the dashboards
This is where my head starts spinning with possibilities — full Step Brothers energy due to all the “activities” that were now on the horizon (almost).
What went wrong (and why it was worth it)
This phase wasn’t “install Helm chart → everything is perfect.” It was a real platform debugging gauntlet. That said, I knew it was coming and welcomed it for the learning experience.
Every mentor I come across in this space preaches the importance of “breaking things” and then fixing it like it’s the only way to truly learn this stuff (and I couldn’t agree more)!
Let’s briefly go over some of the things I faced…
1) Prometheus Operator CRDs weren’t applying cleanly
The symptom wasn’t a dramatic crash — it was the more dangerous kind: “parts of the stack look deployed, but key components never become real Kubernetes resources.”
Useful commands:
kubectl api-resources --api-group=monitoring.coreos.com
kubectl get crd | grep monitoring.coreos.com
kubectl -n monitoring get endpoints monitoring-kube-prometheus-prometheus -o wide
Fix (high level): Treat CRDs as first-class citizens: ensure they’re installed cleanly (and early), then sync the actual chart/app.
Lesson: With Prometheus Operator stacks, CRDs are foundational. If CRDs don’t apply, you can end up in a weird “partially installed” state that wastes hours.
2) CRDs hit the annotation size limit (“metadata.annotations too long”)
This was the dungeon boss. Argo would repeatedly fail applying CRDs due to Kubernetes rejecting overly large annotations.
Smoking-gun command:
kubectl -n argocd describe app monitoring-crds
# ... metadata.annotations: Too long: may not be more than 262144 bytes
Fix (high level):
- Split CRDs into a dedicated Argo app (
monitoring-crds) - Use a CRD-appropriate sync strategy (so Argo stops endlessly patching them)
- Get CRDs healthy first, then sync the rest
Lesson: In GitOps, CRDs often require a different approach than “normal YAML.”
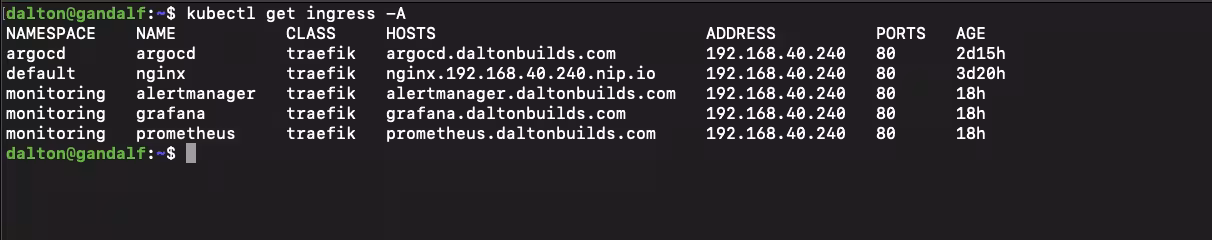
3) “Ghost bugs” from duplicate ingress manifests
At one point I had ingress YAMLs living in multiple places, which created a classic GitOps trap: the cluster was applying a different file than I thought depending on what Argo was actually tracking.
Commands to help me get unstuck:
kubectl get ingress -A | egrep 'argocd|grafana|prometheus|alertmanager'
kubectl -n argocd get apps -o jsonpath='{range .items[*]}{.metadata.name}{"\t"}{.spec.source.path}{"\n"}{end}'
Fix: Consolidate platform ingresses into a single, dedicated folder and manage them through one Argo app.
Lesson: GitOps wants a single source of truth. Duplication creates “what is even true anymore?”
4) Cloudflare Tunnel origin: simple beats clever (for day-1 homelab stability)
I initially pointed the tunnel at an internal cluster DNS origin. It can work (and did at first until one of my nodes hit a NotReady state due to a loose ethernet cable), but it was fragile in my setup. Switching the tunnel origin to the stable ingress/LB IP immediately stabilized access.
Helpful commands:
kubectl -n cloudflared logs deploy/cloudflared --tail=100
dig +short grafana.daltonbuilds.com
curl -I https://grafana.daltonbuilds.com
Fix (high level): Route Cloudflare Tunnel to the stable LAN ingress endpoint (Traefik’s LB IP/port — something like 192.168.10.200:80 for example).
Lesson: For homelabs, a boring origin is a reliable origin.
Where it all sits now
The platform is up and working end-to-end:
- k3s is stable across all three nodes
- Traefik serves ingresses on a stable LAN IP
- Cloudflare Tunnel is up and healthy
- Cloudflare Zero Trust Access is protecting my dashboards
- Monitoring stack components are healthy, and Argo CD is functioning as the control plane for changes
What’s Next
Now that the platform is stable, it’s time for actual workloads:
- A simple “starter” app to validate the full pipeline (maybe Audiobookshelf)
- Then: something more involved like n8n
- Persistent storage: Right now dashboards are running with
emptyDir: {}for speed/iteration. Next I’ll introduce durable storage (likely Longhorn or another CSI-backed option) so stateful components like Grafana/Prometheus survive node restarts and upgrades. - Then: take the same patterns to managed cloud Kubernetes environments (all of the big three: GCP, AWS, Azure)
Repo
Follow along here: https://github.com/DaltonBuilds/homelab-gitops